Linkedin Automation Dashboard
A live overview of your LinkedIn accounts, campaigns, and outreach performance.
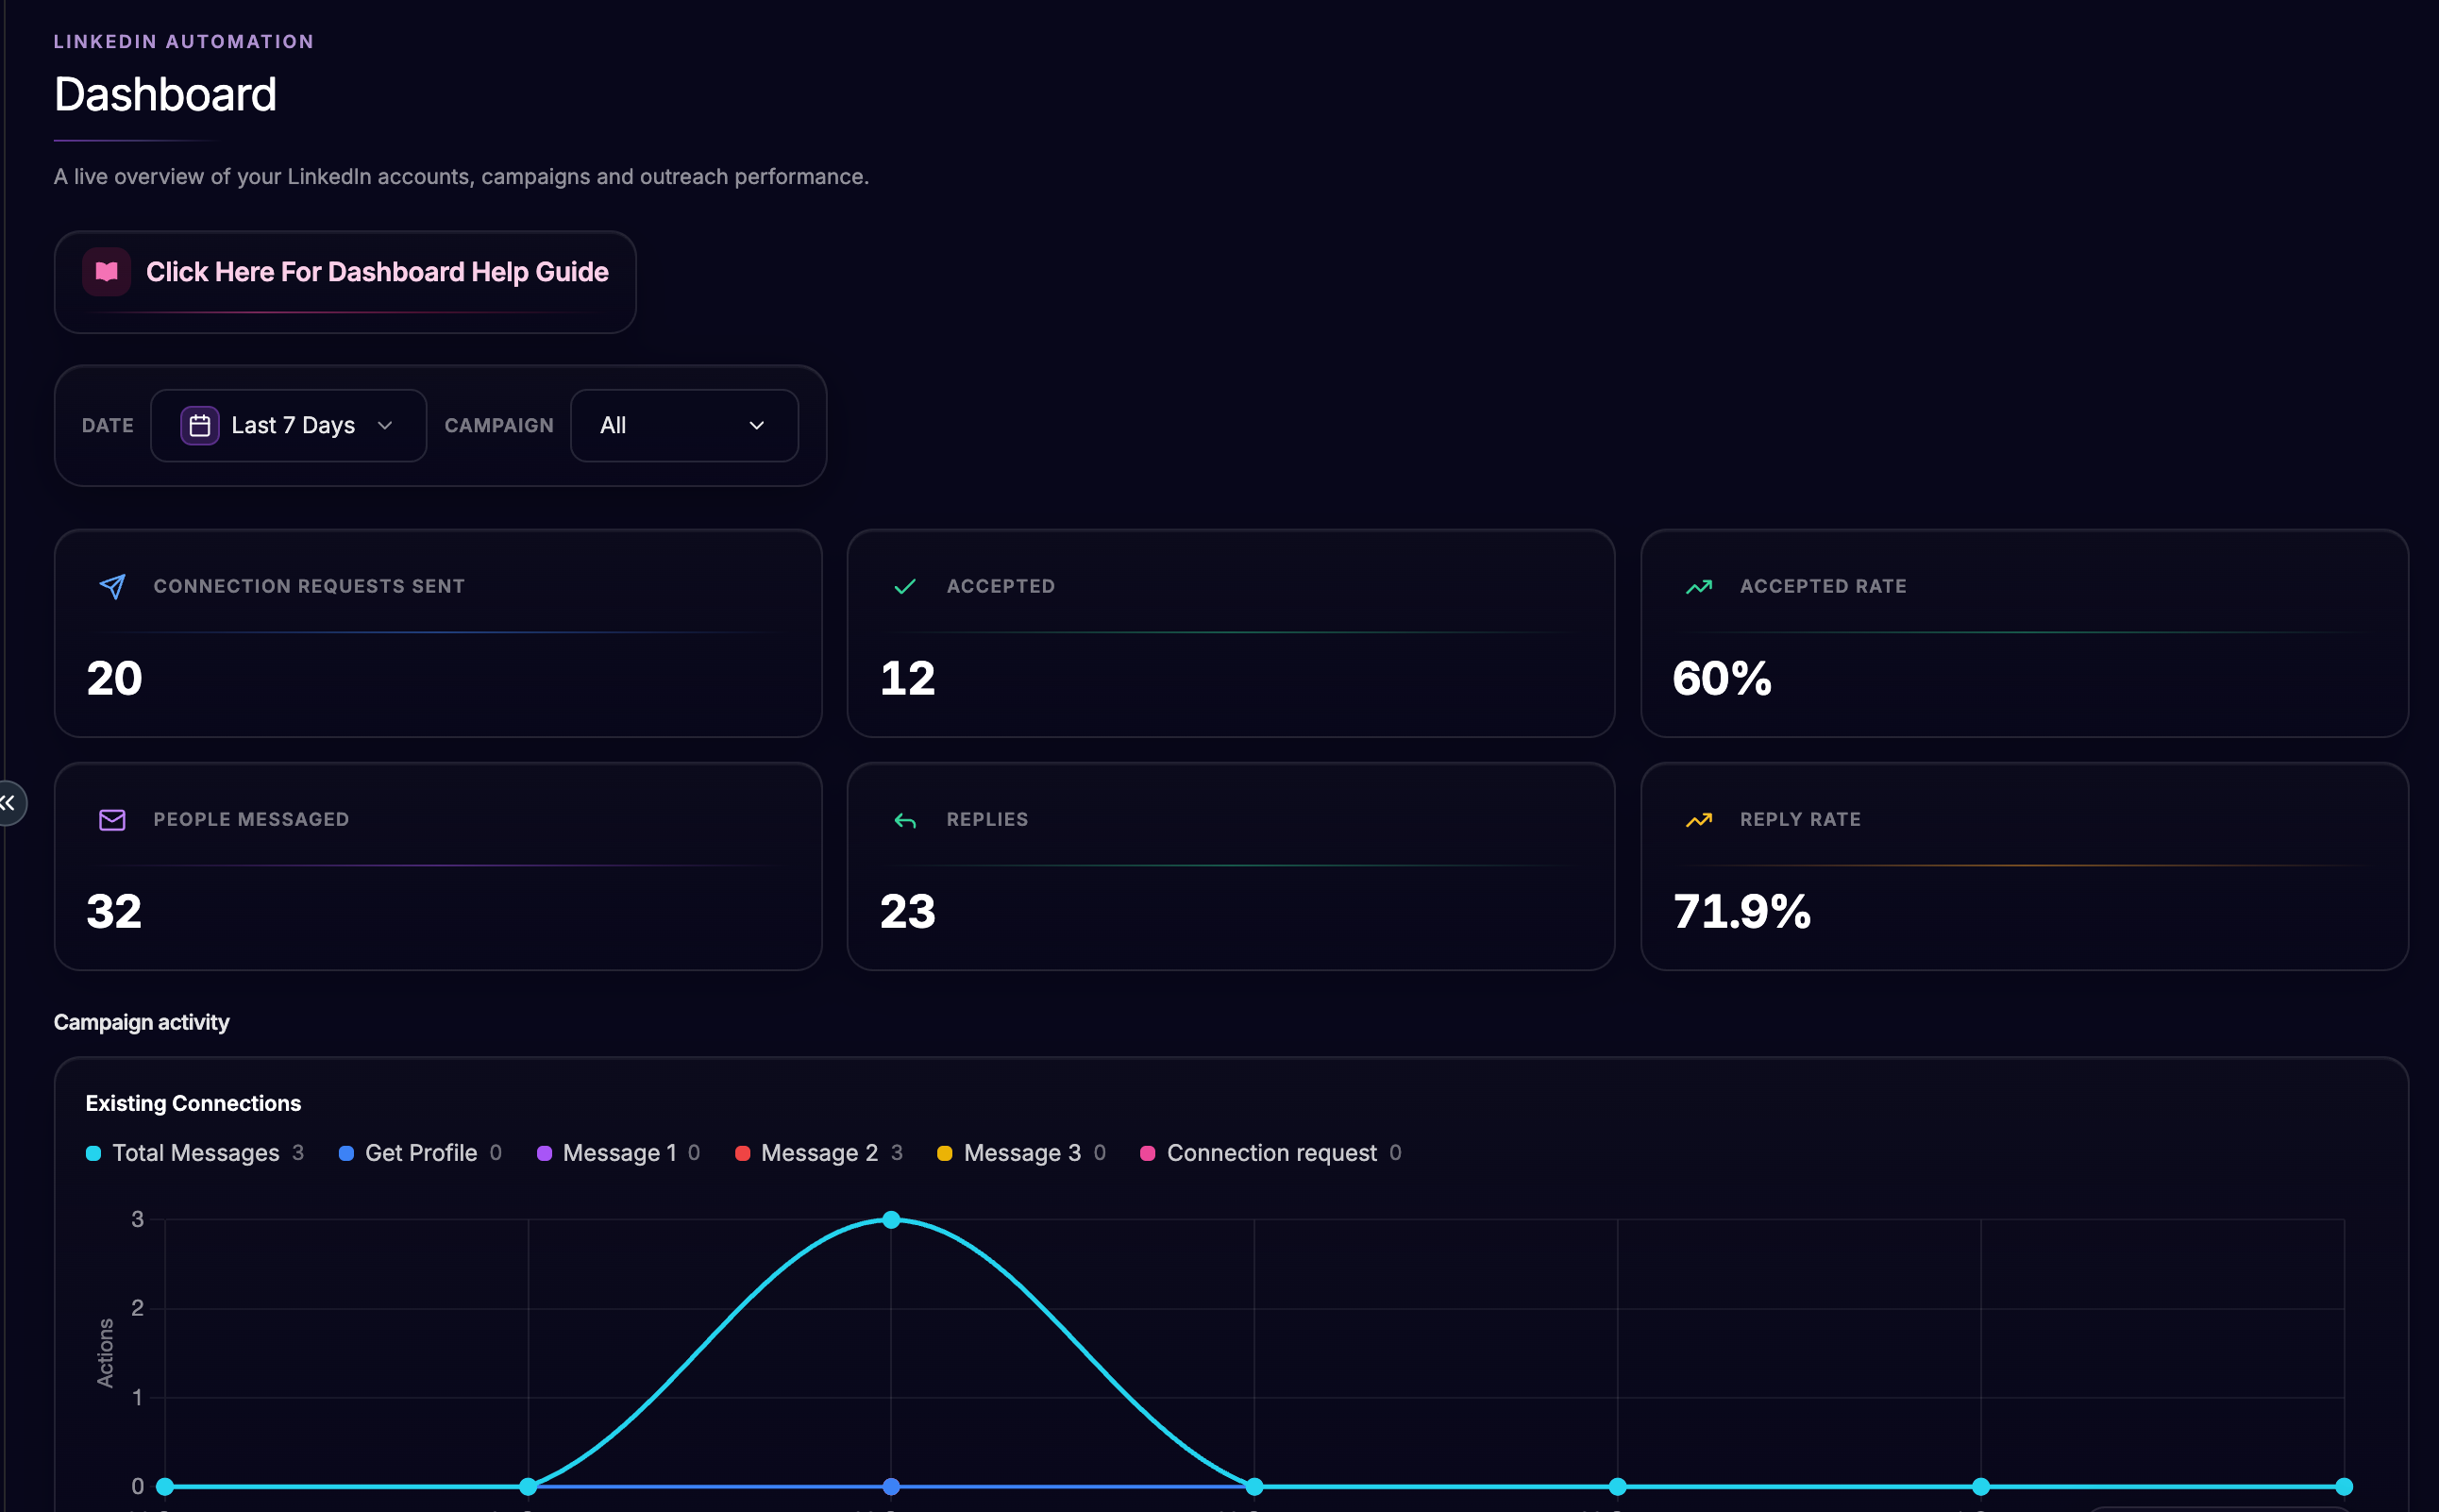
The Dashboard shows a live overview of your LinkedIn Automation performance: key stats and per-campaign activity over a date range.
Step 1: Open Dashboard
Log in to Topa
In the sidebar, open LinkedIn Automation
Click Dashboard
Step 2: Set Filters
Date — choose a range (default is Last 7 Days)
Campaign — choose All, or one campaign that has activity in this timeframe
Only campaigns with activity during the selected timeframe appear in the Campaign dropdown. If the selected campaign has no activity in a new date range, the filter resets to All.
Step 3: Read the Stats
Connection Requests Sent — unique people who received a connection request in this date range
Accepted — unique people who accepted a connection request
Accepted Rate — Accepted ÷ Connection Requests Sent
People Messaged — unique people who received a message
Replies — unique people who replied
Reply Rate — Replies ÷ People Messaged
Click any stat card to open a list of the people behind that number. You can search the list when there are many people.
Step 4: Campaign Activity
Scroll to Campaign activity to see daily charts per campaign, including totals such as Total Messages, Get Profile, Message 1 / 2 / 3, and Connection request.
Important Notes
Stats count unique people in the selected date window, not lifetime campaign totals
Existing Connections campaigns usually will not move Connection Requests Sent or Accepted (they do not send invites) — they mainly drive People Messaged and Replies
If you have no campaigns yet, the Dashboard shows sample data until you connect an account and launch a campaign
Was this helpful?
Still need help? Ask the team